Background
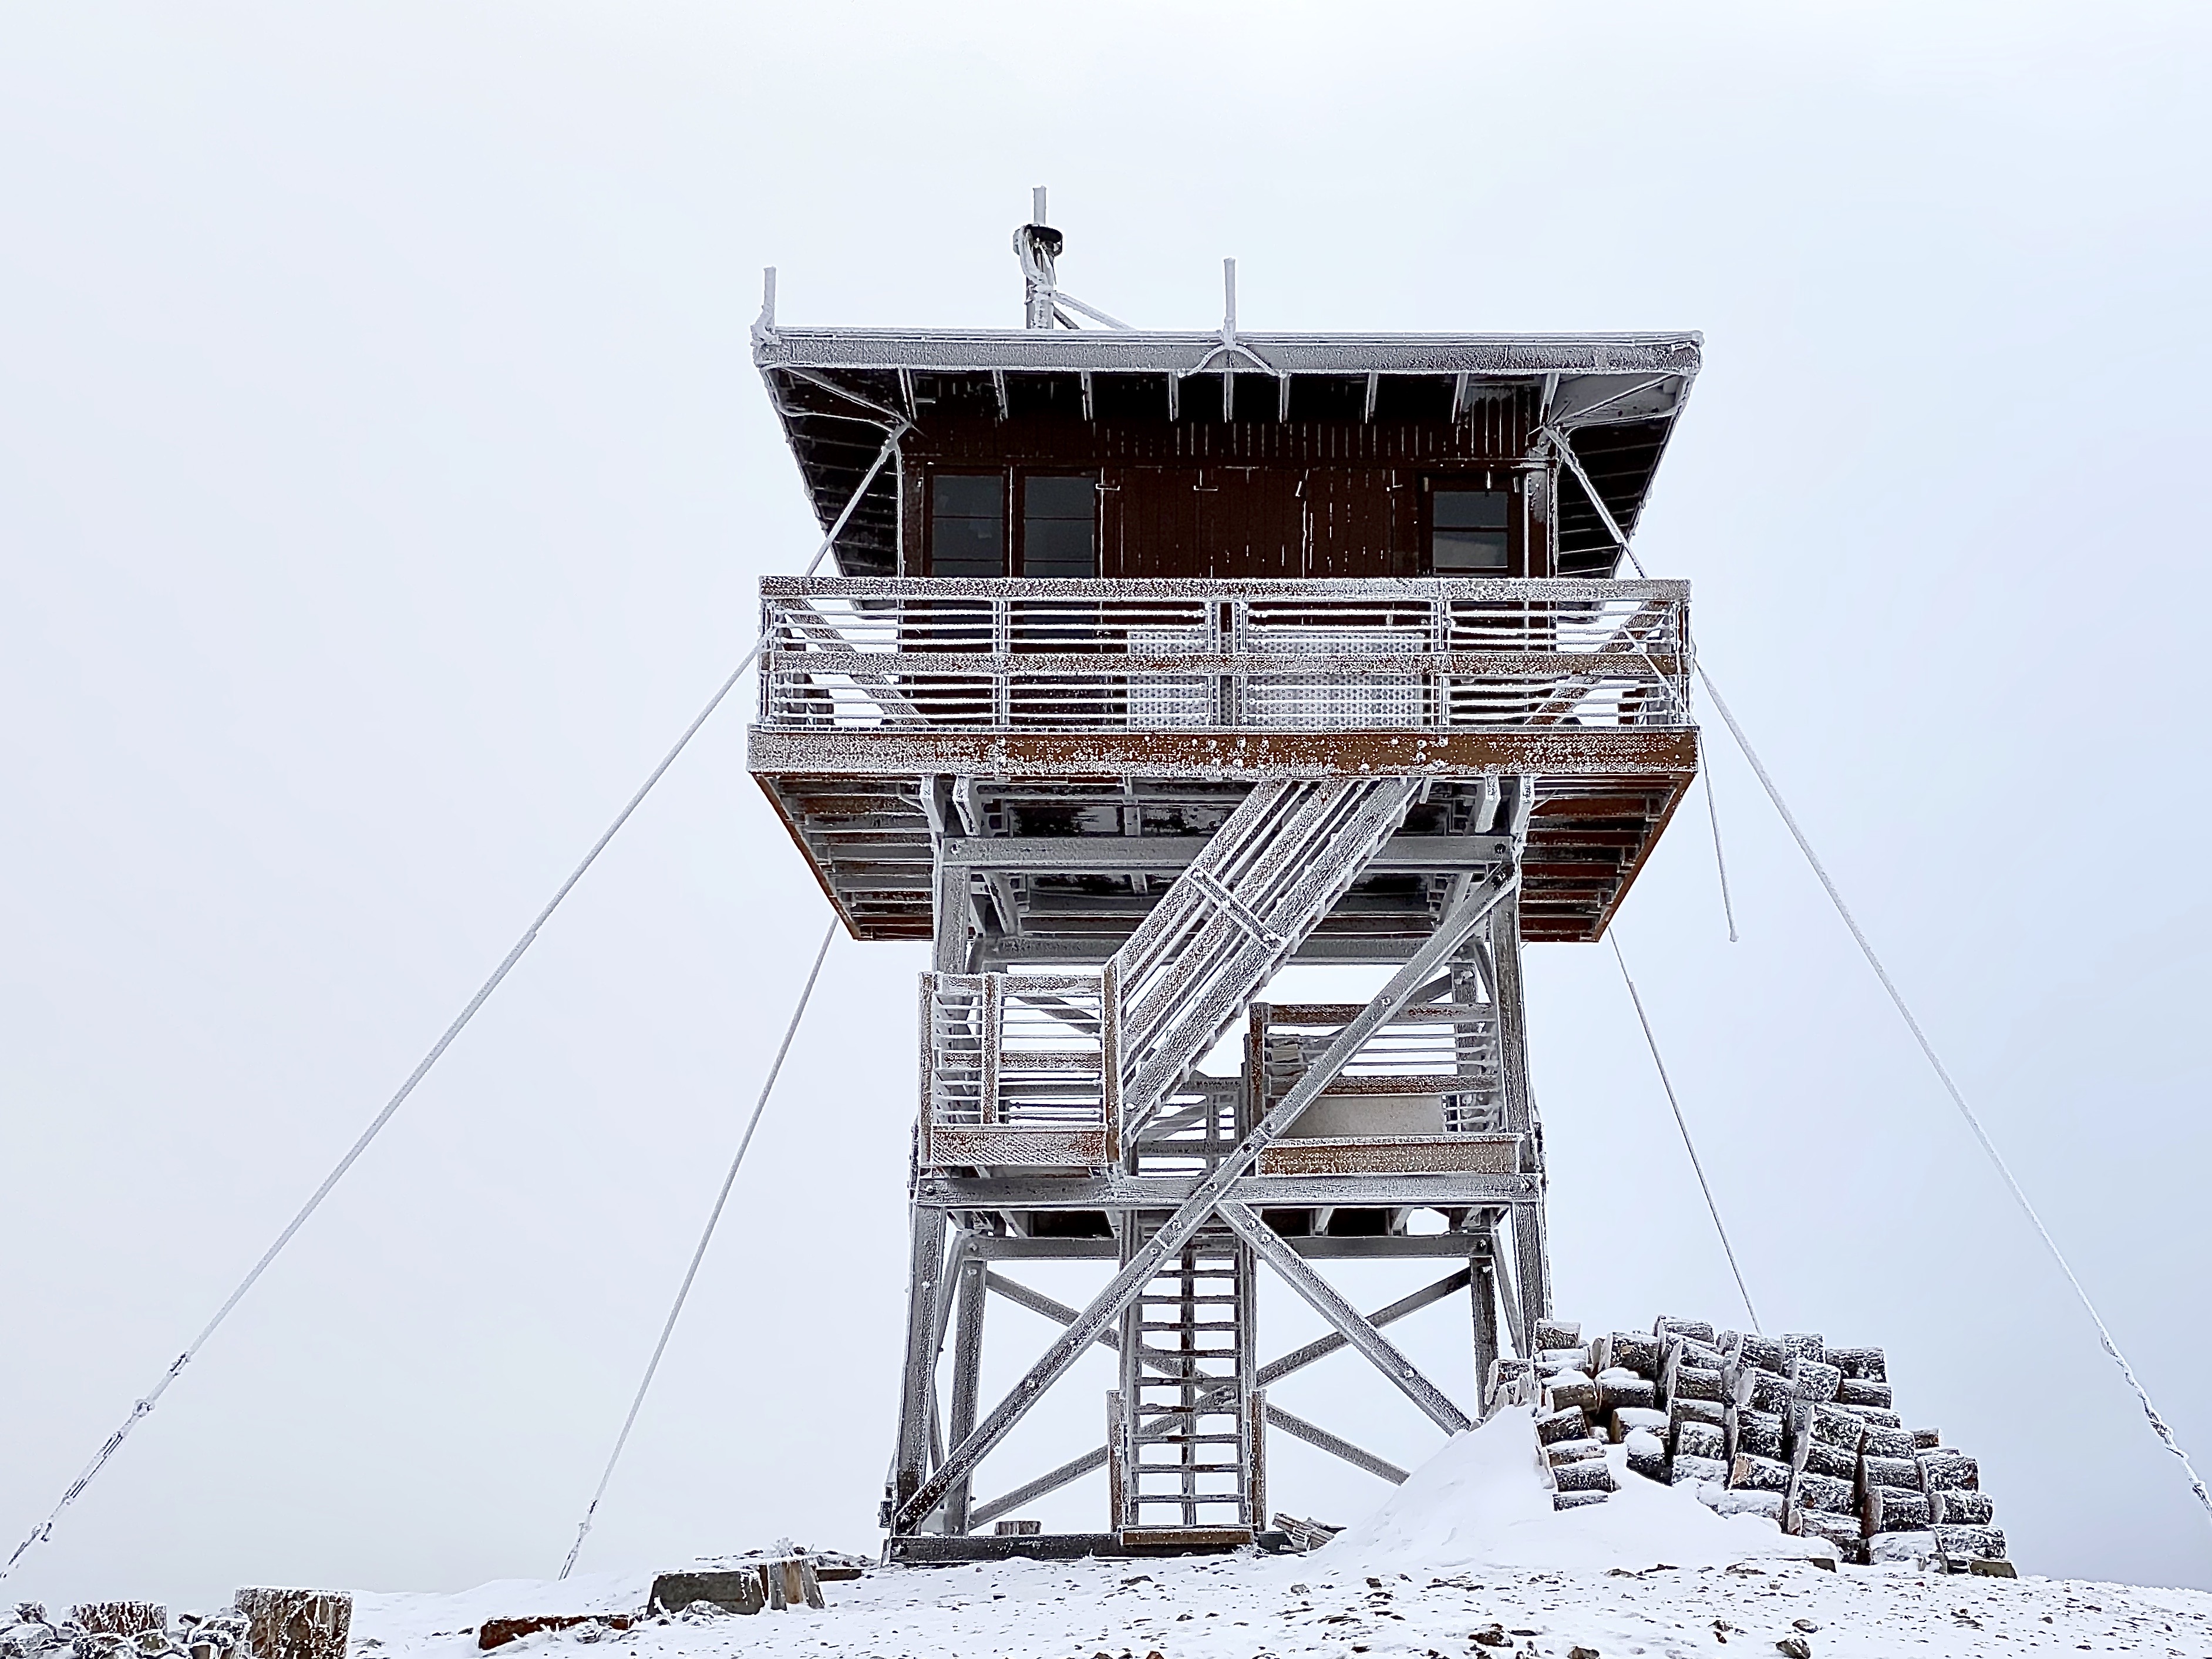
Established in 2003, recreation.gov manages over 3 million reservations every year for US public lands such as National Parks, Forest Service Campgrounds, and BLM. These reservations range from permit lotteries to firetower rentals.
Every reservation made from 2006 through 2018 is available for public download via the RIDB API: about 10 gigabytes of data.This repository explores how far a customer is willing to travel to a campground and how long they stay once there.
Data
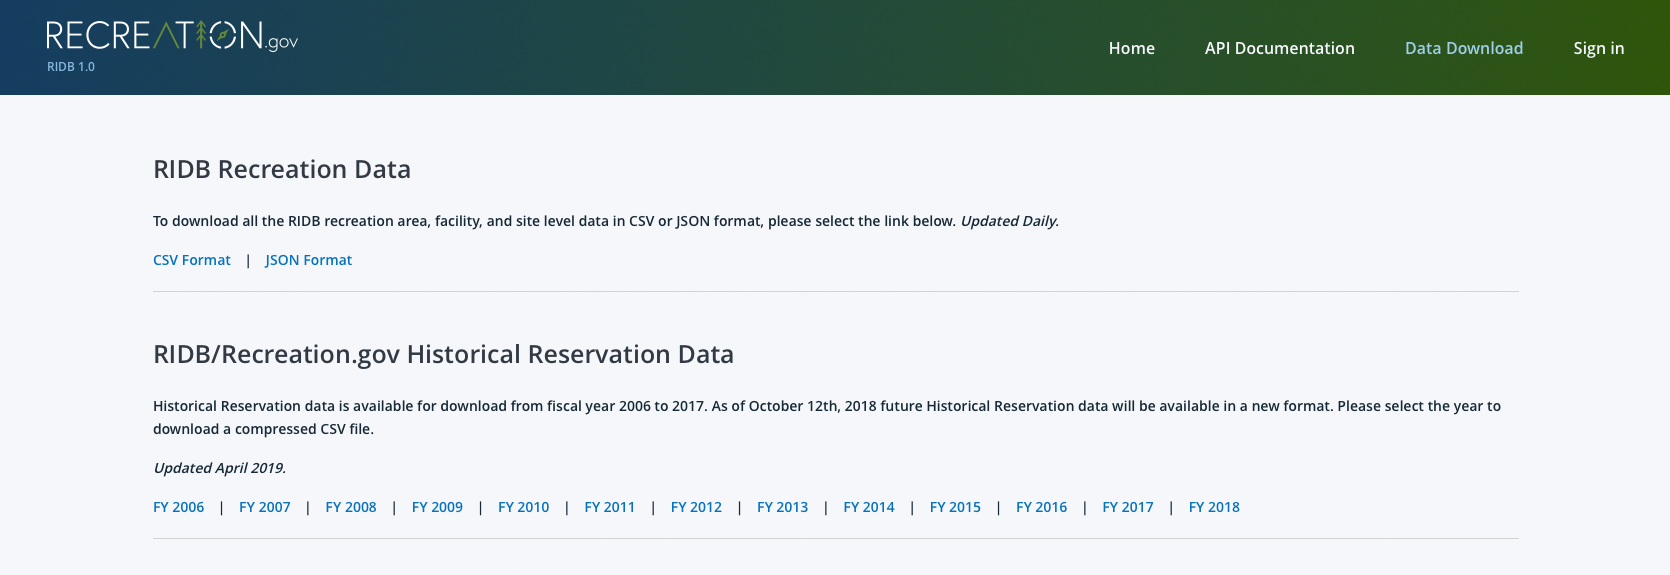
The reservation data is provided as a seperate .csv for every year. Each year has 57 columns, 22 of which are (mostly) one-hot encoded category types. This analysis included:
In addition to the reservations, relational databases of campground information are also available for download. One can extract another 50 attributes for every FacilityID.
Exploratory Analysis
EDA reveals relatively messy data. Of the 29,055,989 reservations, 12 columns have data in less than 1% of the rows. Many usefull columns are 60% null.

Interestingly, Marinaboat has only one non-null value in all of the years. Further, that one non-null is not boolean:

Also, it is doubtful that someone parked their boat 5 miles inland at Haleakala National Park's sunrise hike:

Formatting within the columns is mostly consistent, but does require type casting, truncation, and removing impurities.

For most queries, 35% of the data is removed for either formating or nulls. For sorting by FacilityZIP, an unfortunate 60% is removed due to nulls, but typically at least 1 million rows remain in each year's data.
Methods
Big Data
This project uses an Amazon Web Service's m5a.8xlarge EC2 instance. The instance runs and starts a docker pyspark container. The scripts in GitHub repo issue SQL queries into a SparkContext for cleaning.
Additionally, ZIP codes are converted into latitudes and longitudes, then the distance between the customer's home and the facility is calculated, adding a column for each step. The average computation time is 45 minutes per year's data.
Lastly, the results are saved as .pickles in the data/cleaned directories. The clean .pkl files are moved into AWS S3 storage, for backup / download with the S3 scripts.
All scripts are built to run on every file in a specified directory. Adding future years to the analysis is done by simply adding a .csv in the raw folder, and running all necessary srcripts.
Matplotlib
For first analysis, a histogram of the duration of stays is created. This histogram is used to decide the two LengthOfStay bins: weekend trips and trips longer than two nights; roughly half of the reservations belong in each category.
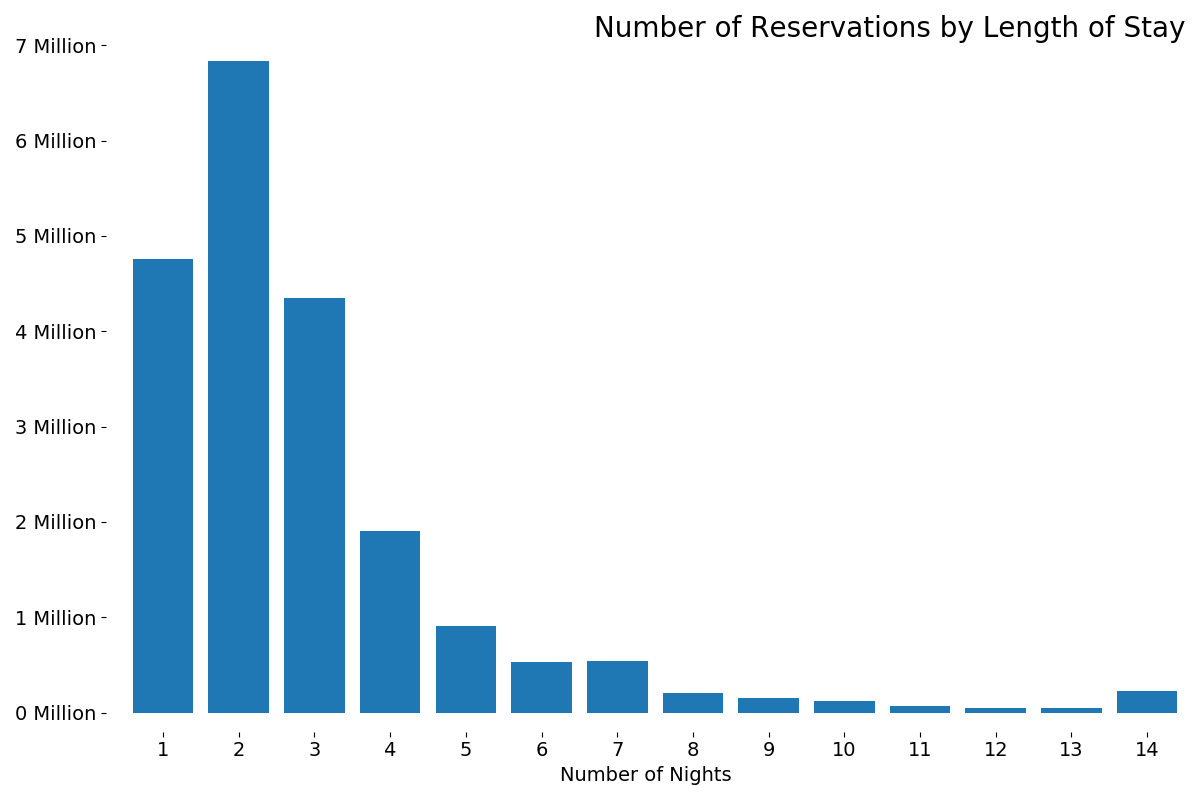
One's intuition is likely correct here. Reservations are usually two nights: the length of a weekend. Counts rapidly decline until another steep drop between 7 and 8 nights: the length of a week. Finally, there's a small spike at 14 nights: the maximum length of stay at most facilities.
Folium, selenium, and PIL
Folium is used to generate maps of the average distance between the CustomerZIP and the campground's location grouped by either the CustomerState or the FacilityState. Selenium.webdriver is used to generate .png images from folium's interactive maps, and PIL converts the .png files into a .gif as seen above.
Conclusions
Distance Traveled vs. Number of Nights
This analysis found no direct correlation between the average distance traveled[1] and number of nights one stays at a facility. In almost every year, the standard deviation of the averages is greater than the mean itself.
The power of this test is reduced by reservations made to/from Alaska and Hawaii where the distances are inherently larger than other states. Computation time did not allow for excluding these states as outliers.
That being said, the statistical distribution of the averages for each year do appear to differ with a pseudo p value of = 0.016
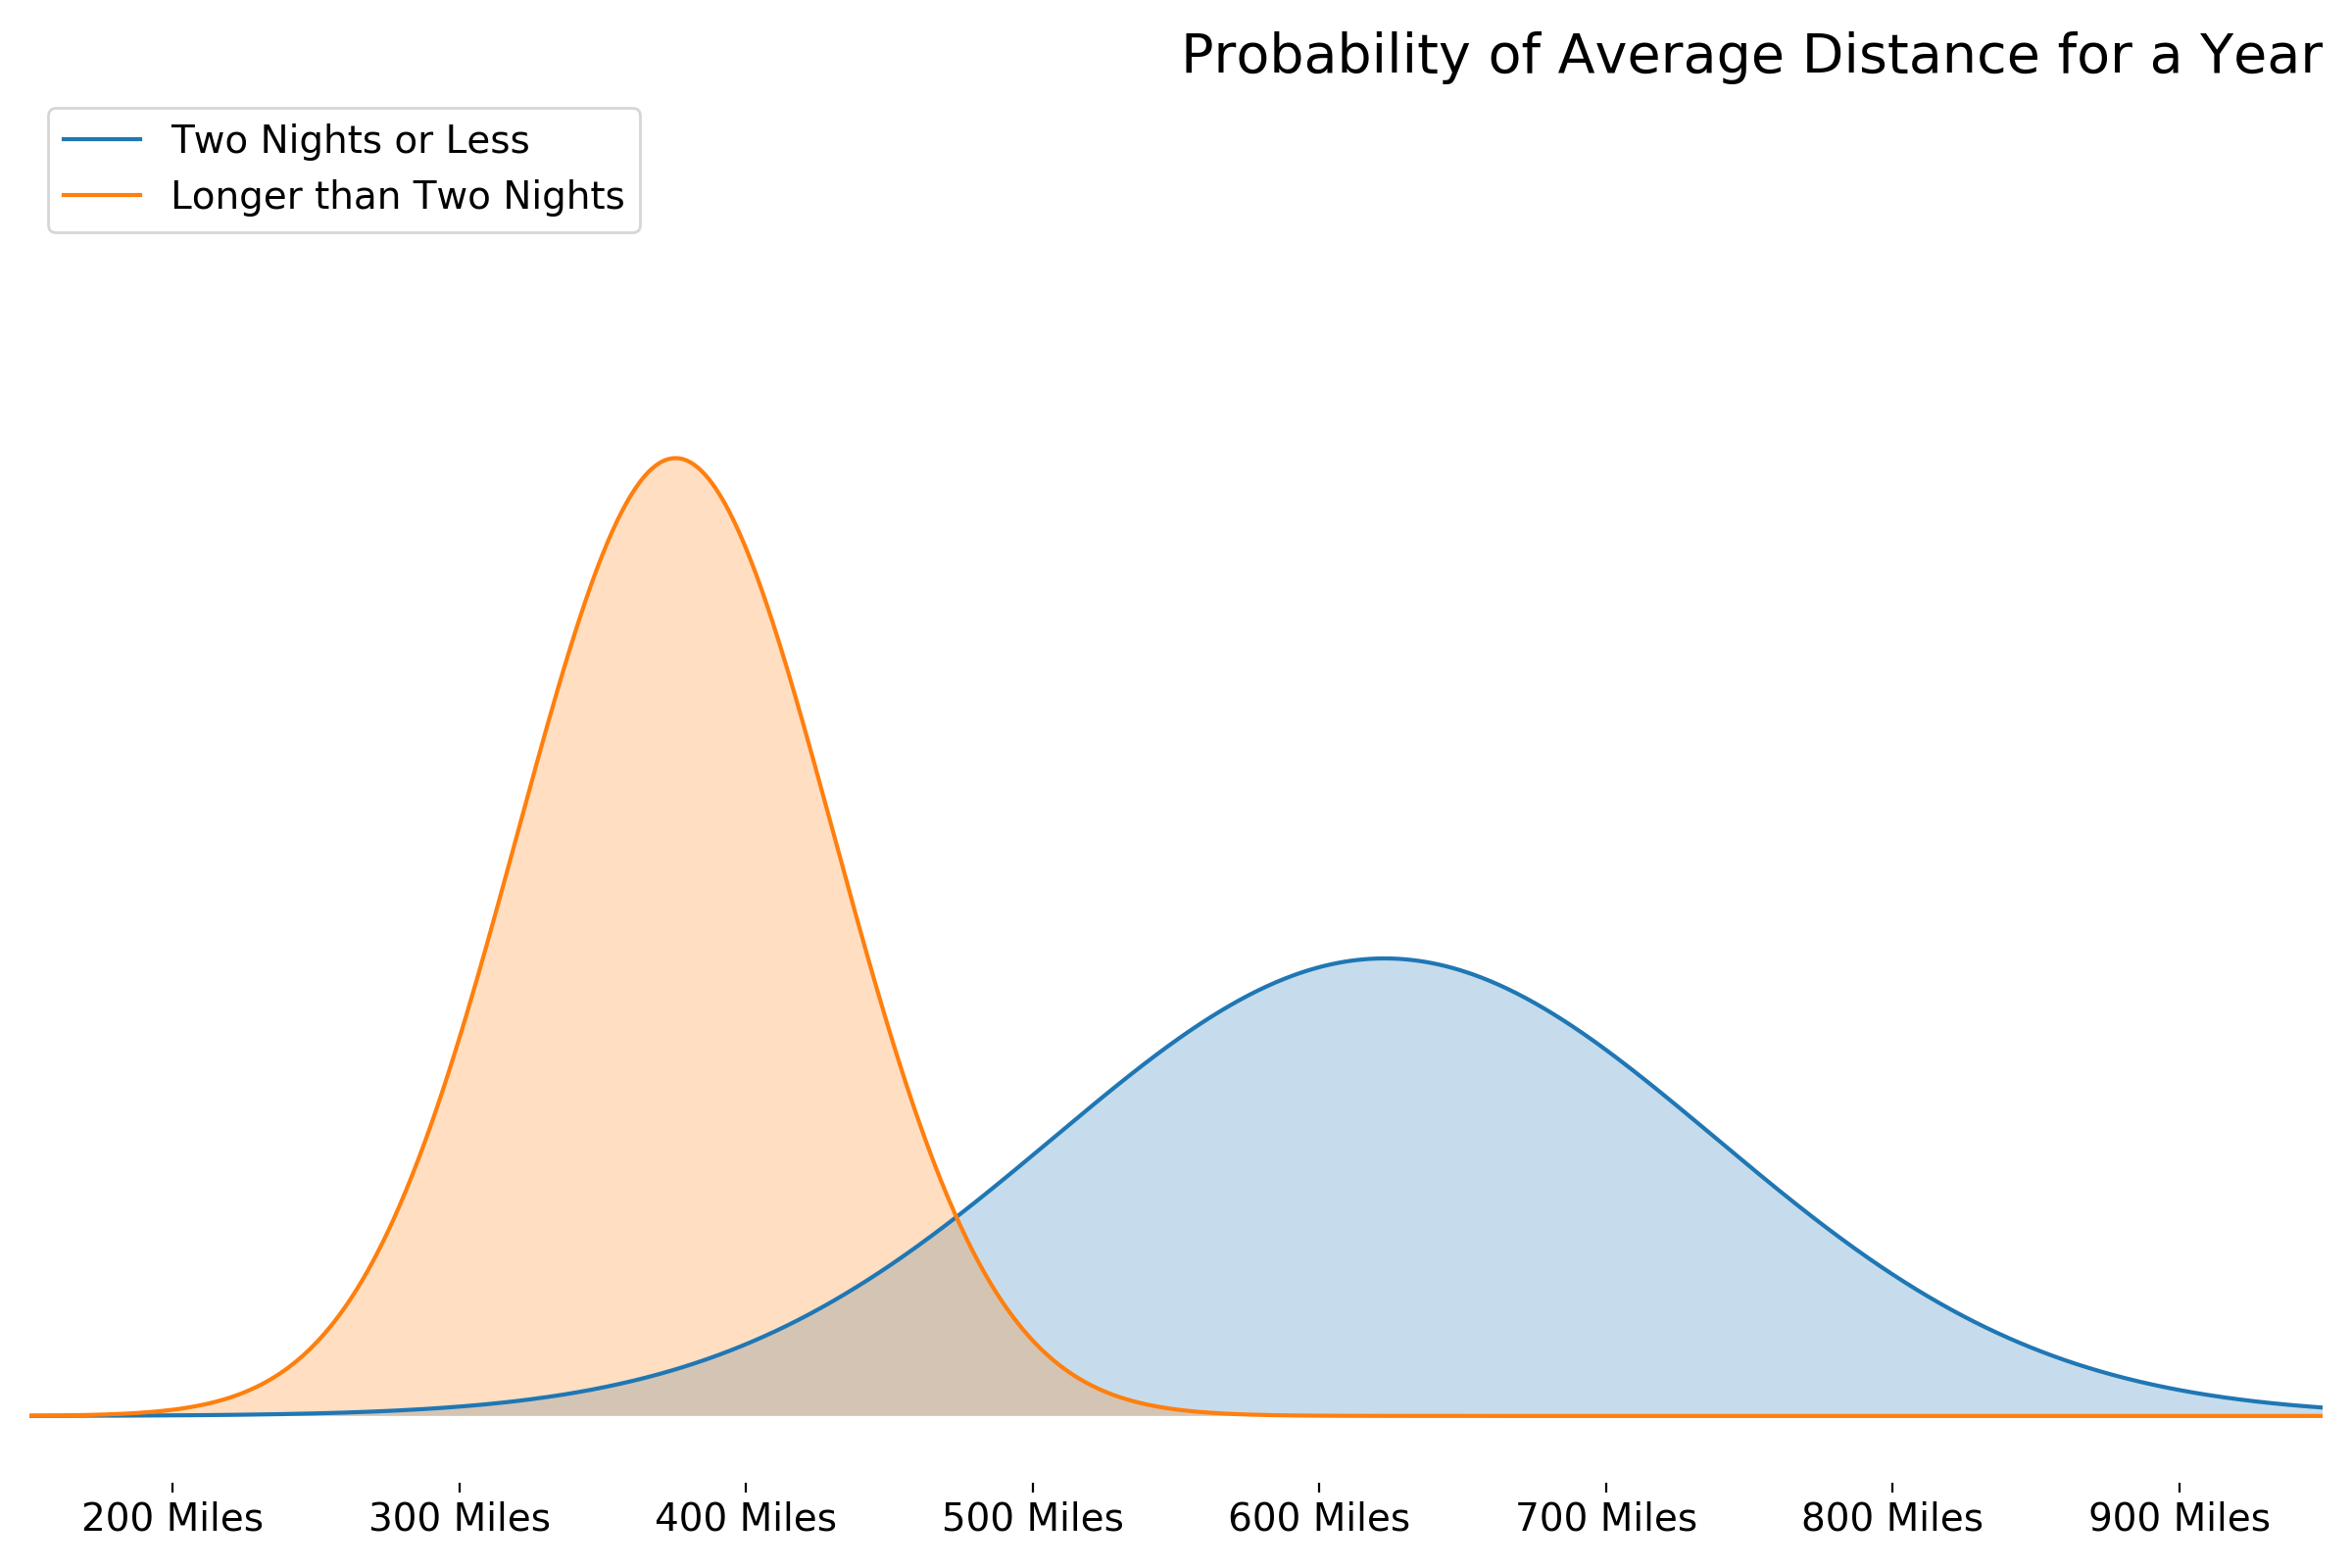
These results are counterintuitive; it seems people travel longer the shorter the stay. A further complication is that driving 650 miles one way for "weekend warrior" trip is very unrealistic.
Fundamentally, this analysis is likely not accounting for how people actually camp. The premis that distance traveled to a facility is equal to the distance from the home address is evidently wrong. In reality, it is possible that reservations are linked together on road trips longer than a weekend, where the distance actually traveled is much less than the distance all the way home.
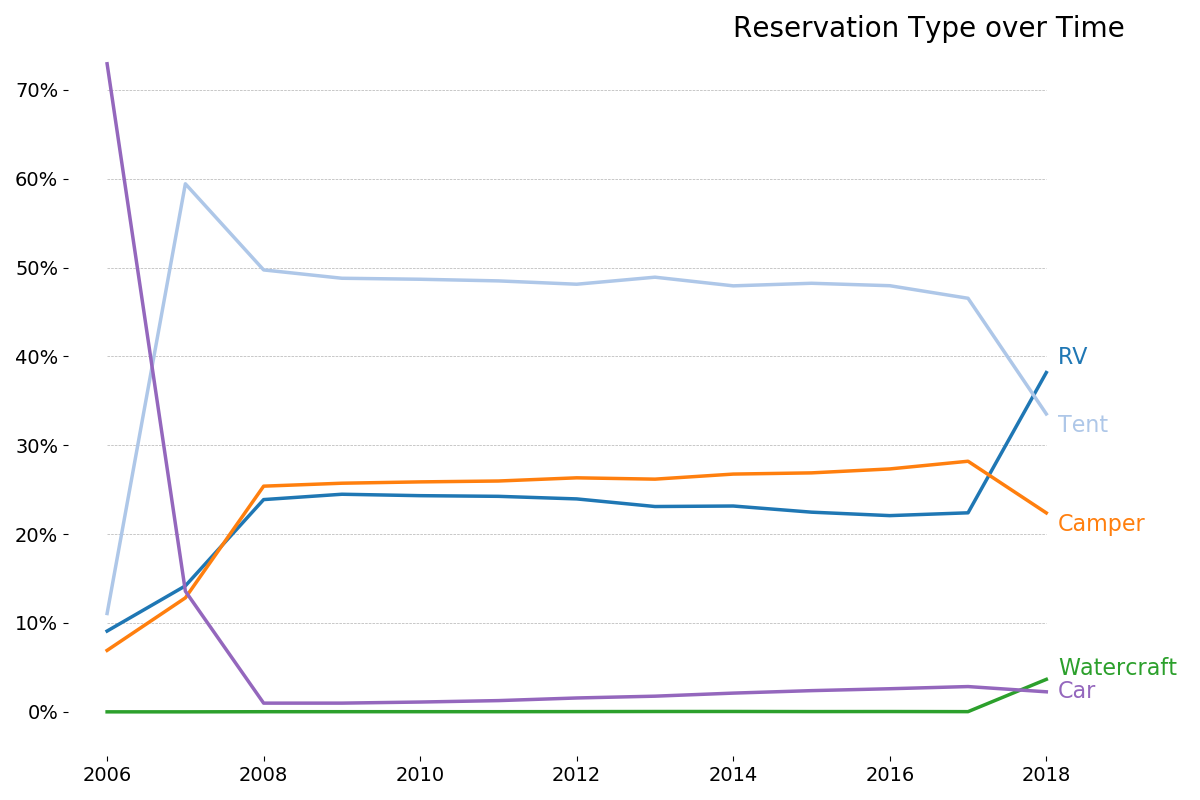
The large proportion of reservations made for RV's and other motorized transport adds evidence to this notion.
Maps
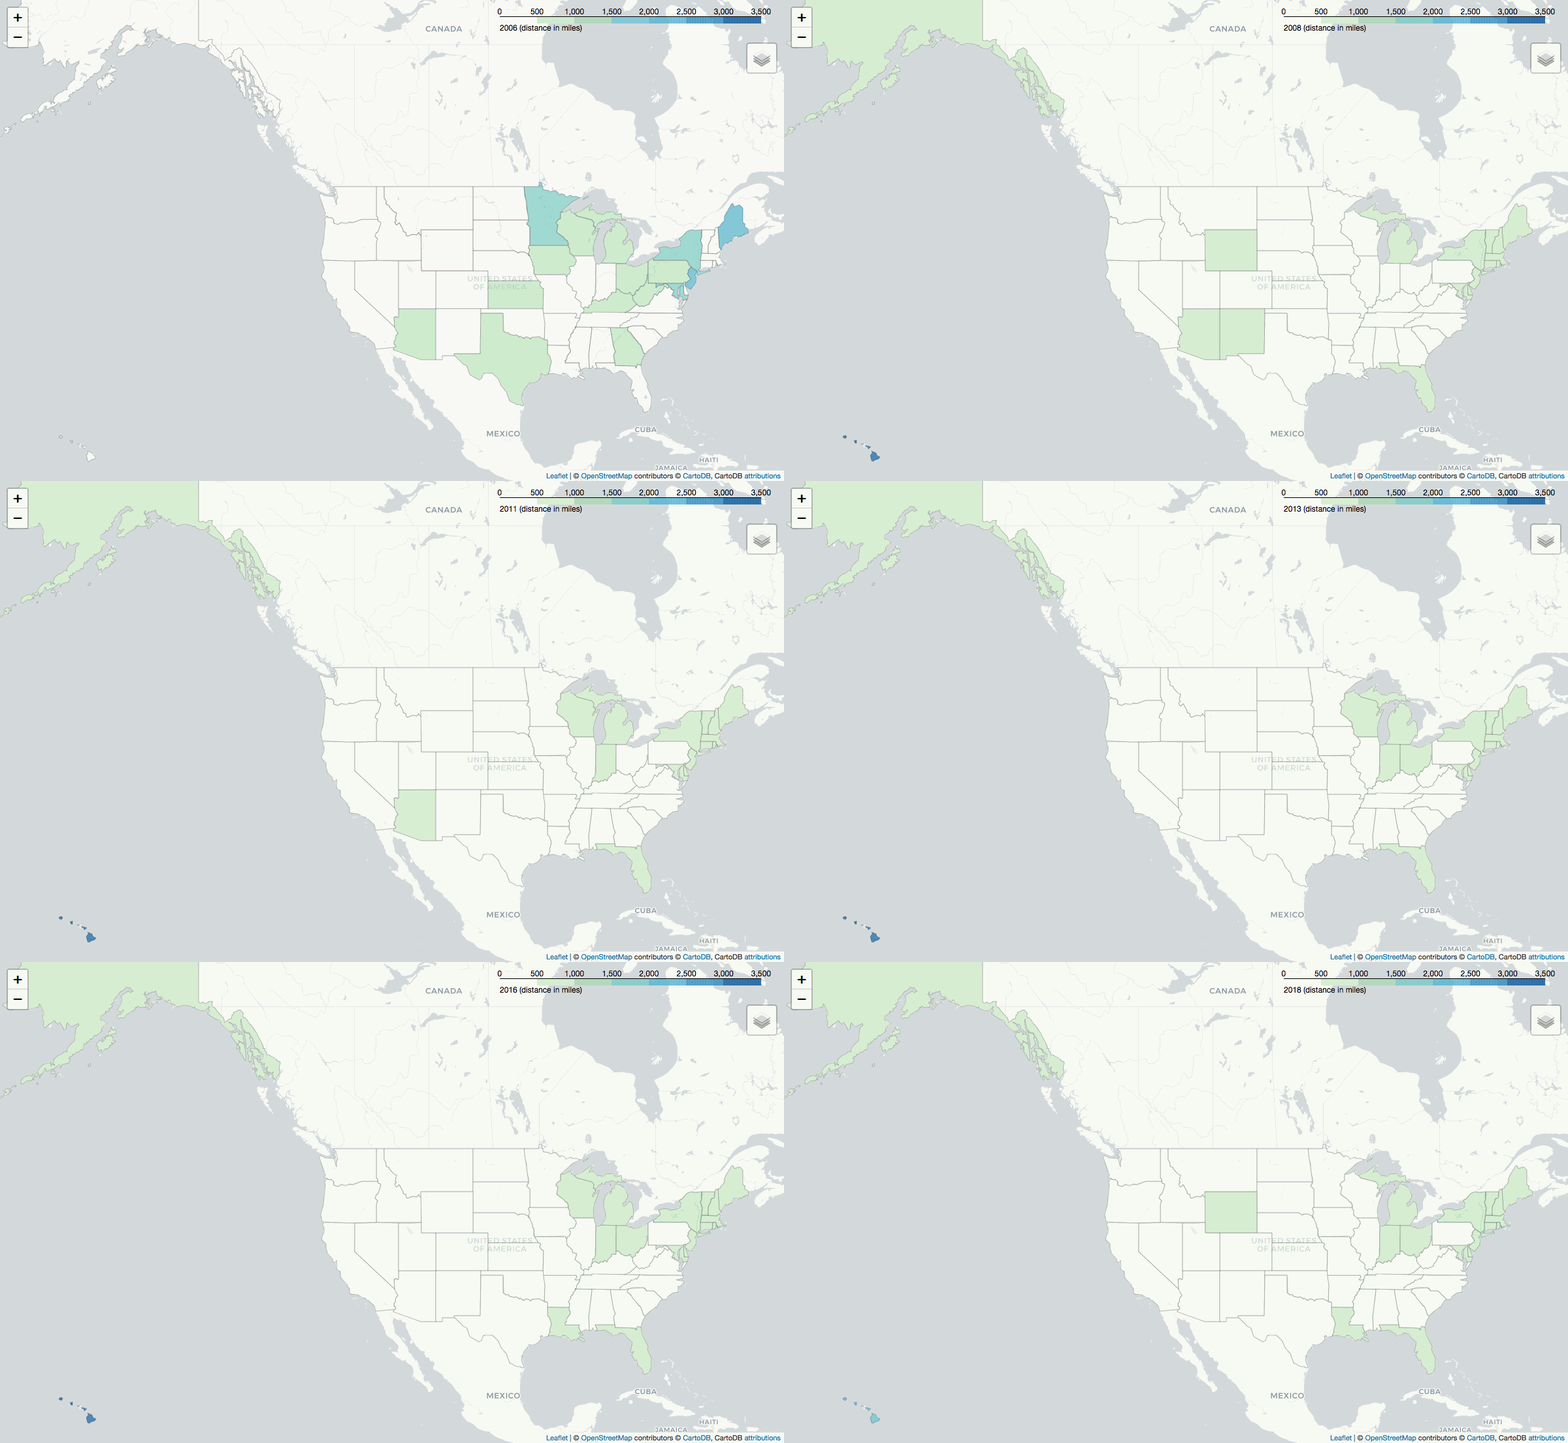
Distance by Customer's State
Furthermore, on average, reservations made from the North East and Florida[2] are for a distance of greater than 1,000 miles. The .gif below shows the average reservation distance grouped by customer state: the distance someone travels based on where they live.
Distance by Destination's State
Lastly, the .gif below shows the average reservation's distance, grouped by the facility's state: how far one is willing to travel to a state given the camping oportunities in that state.
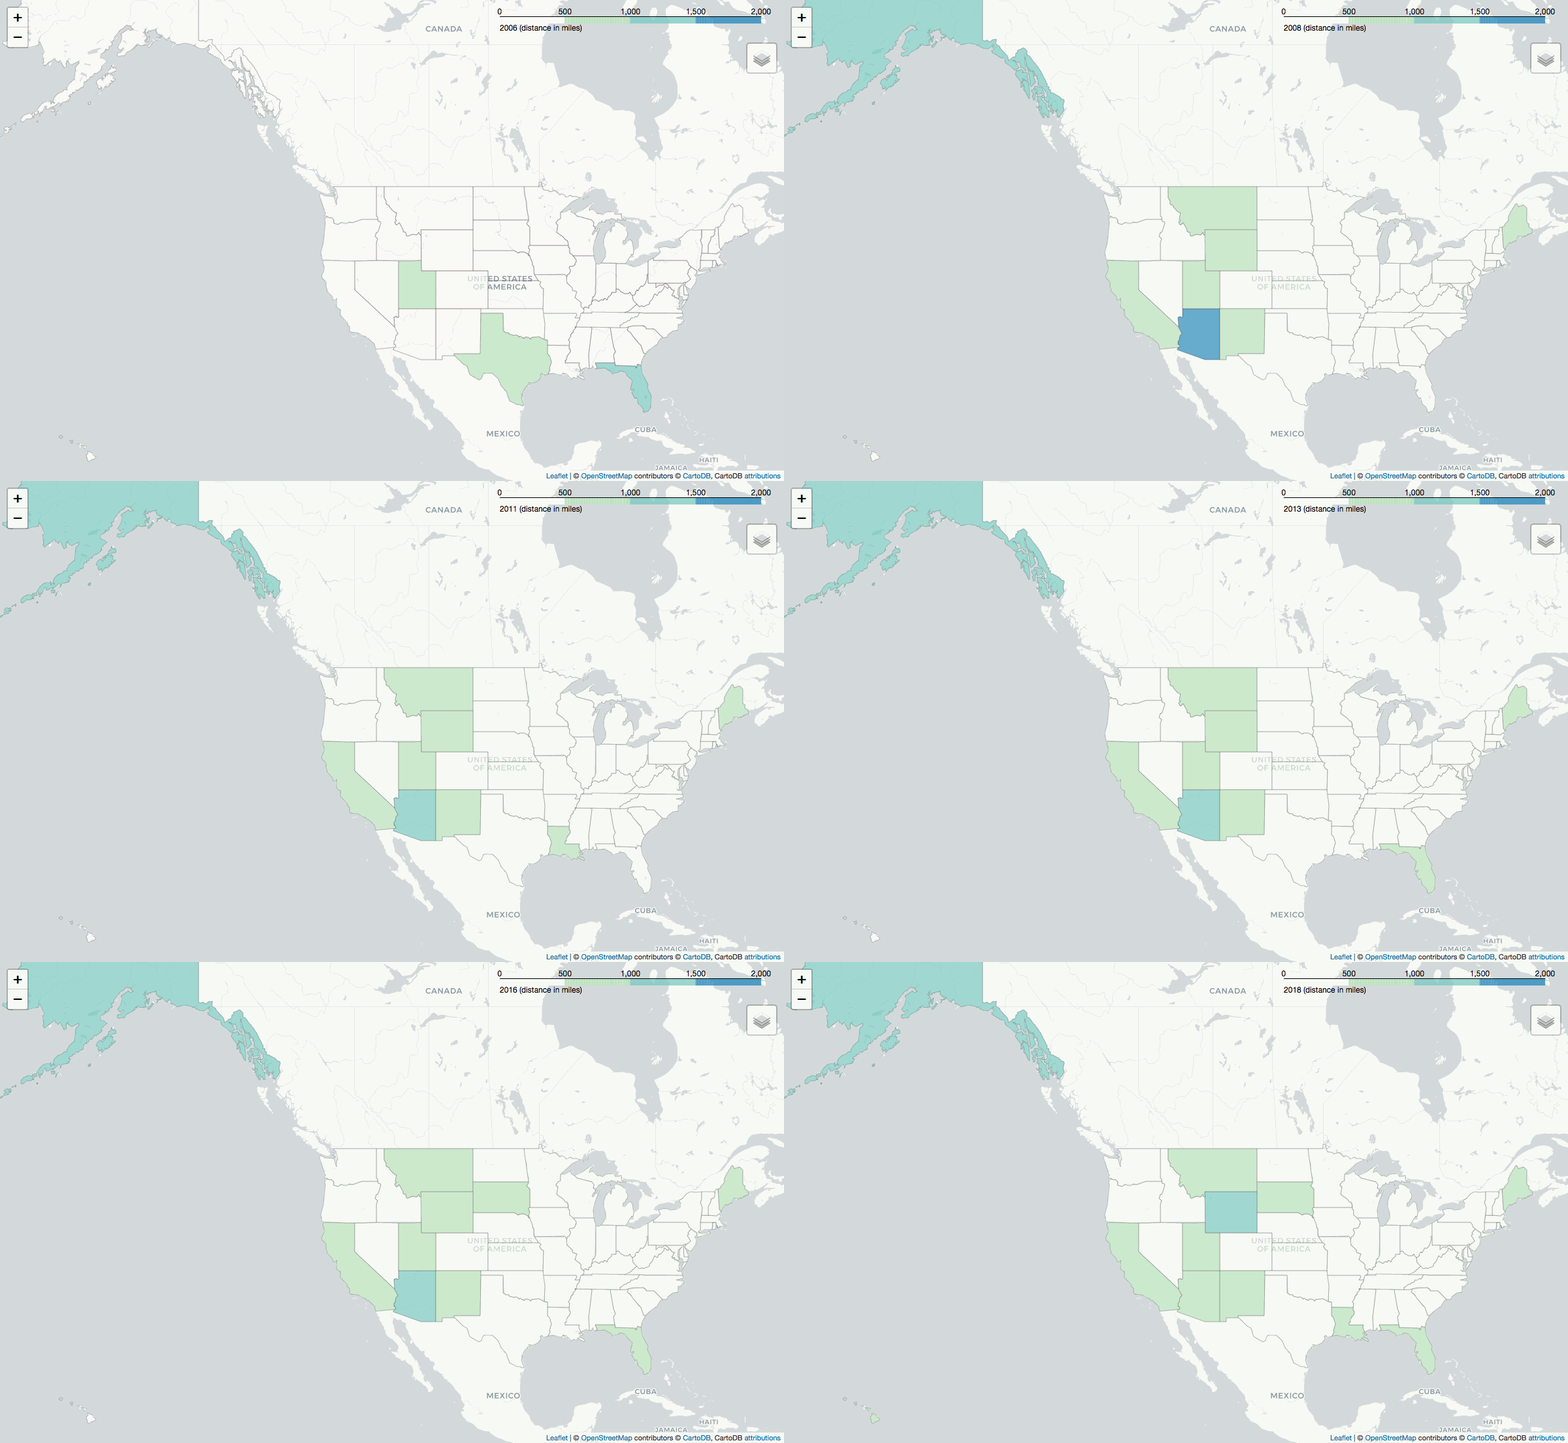
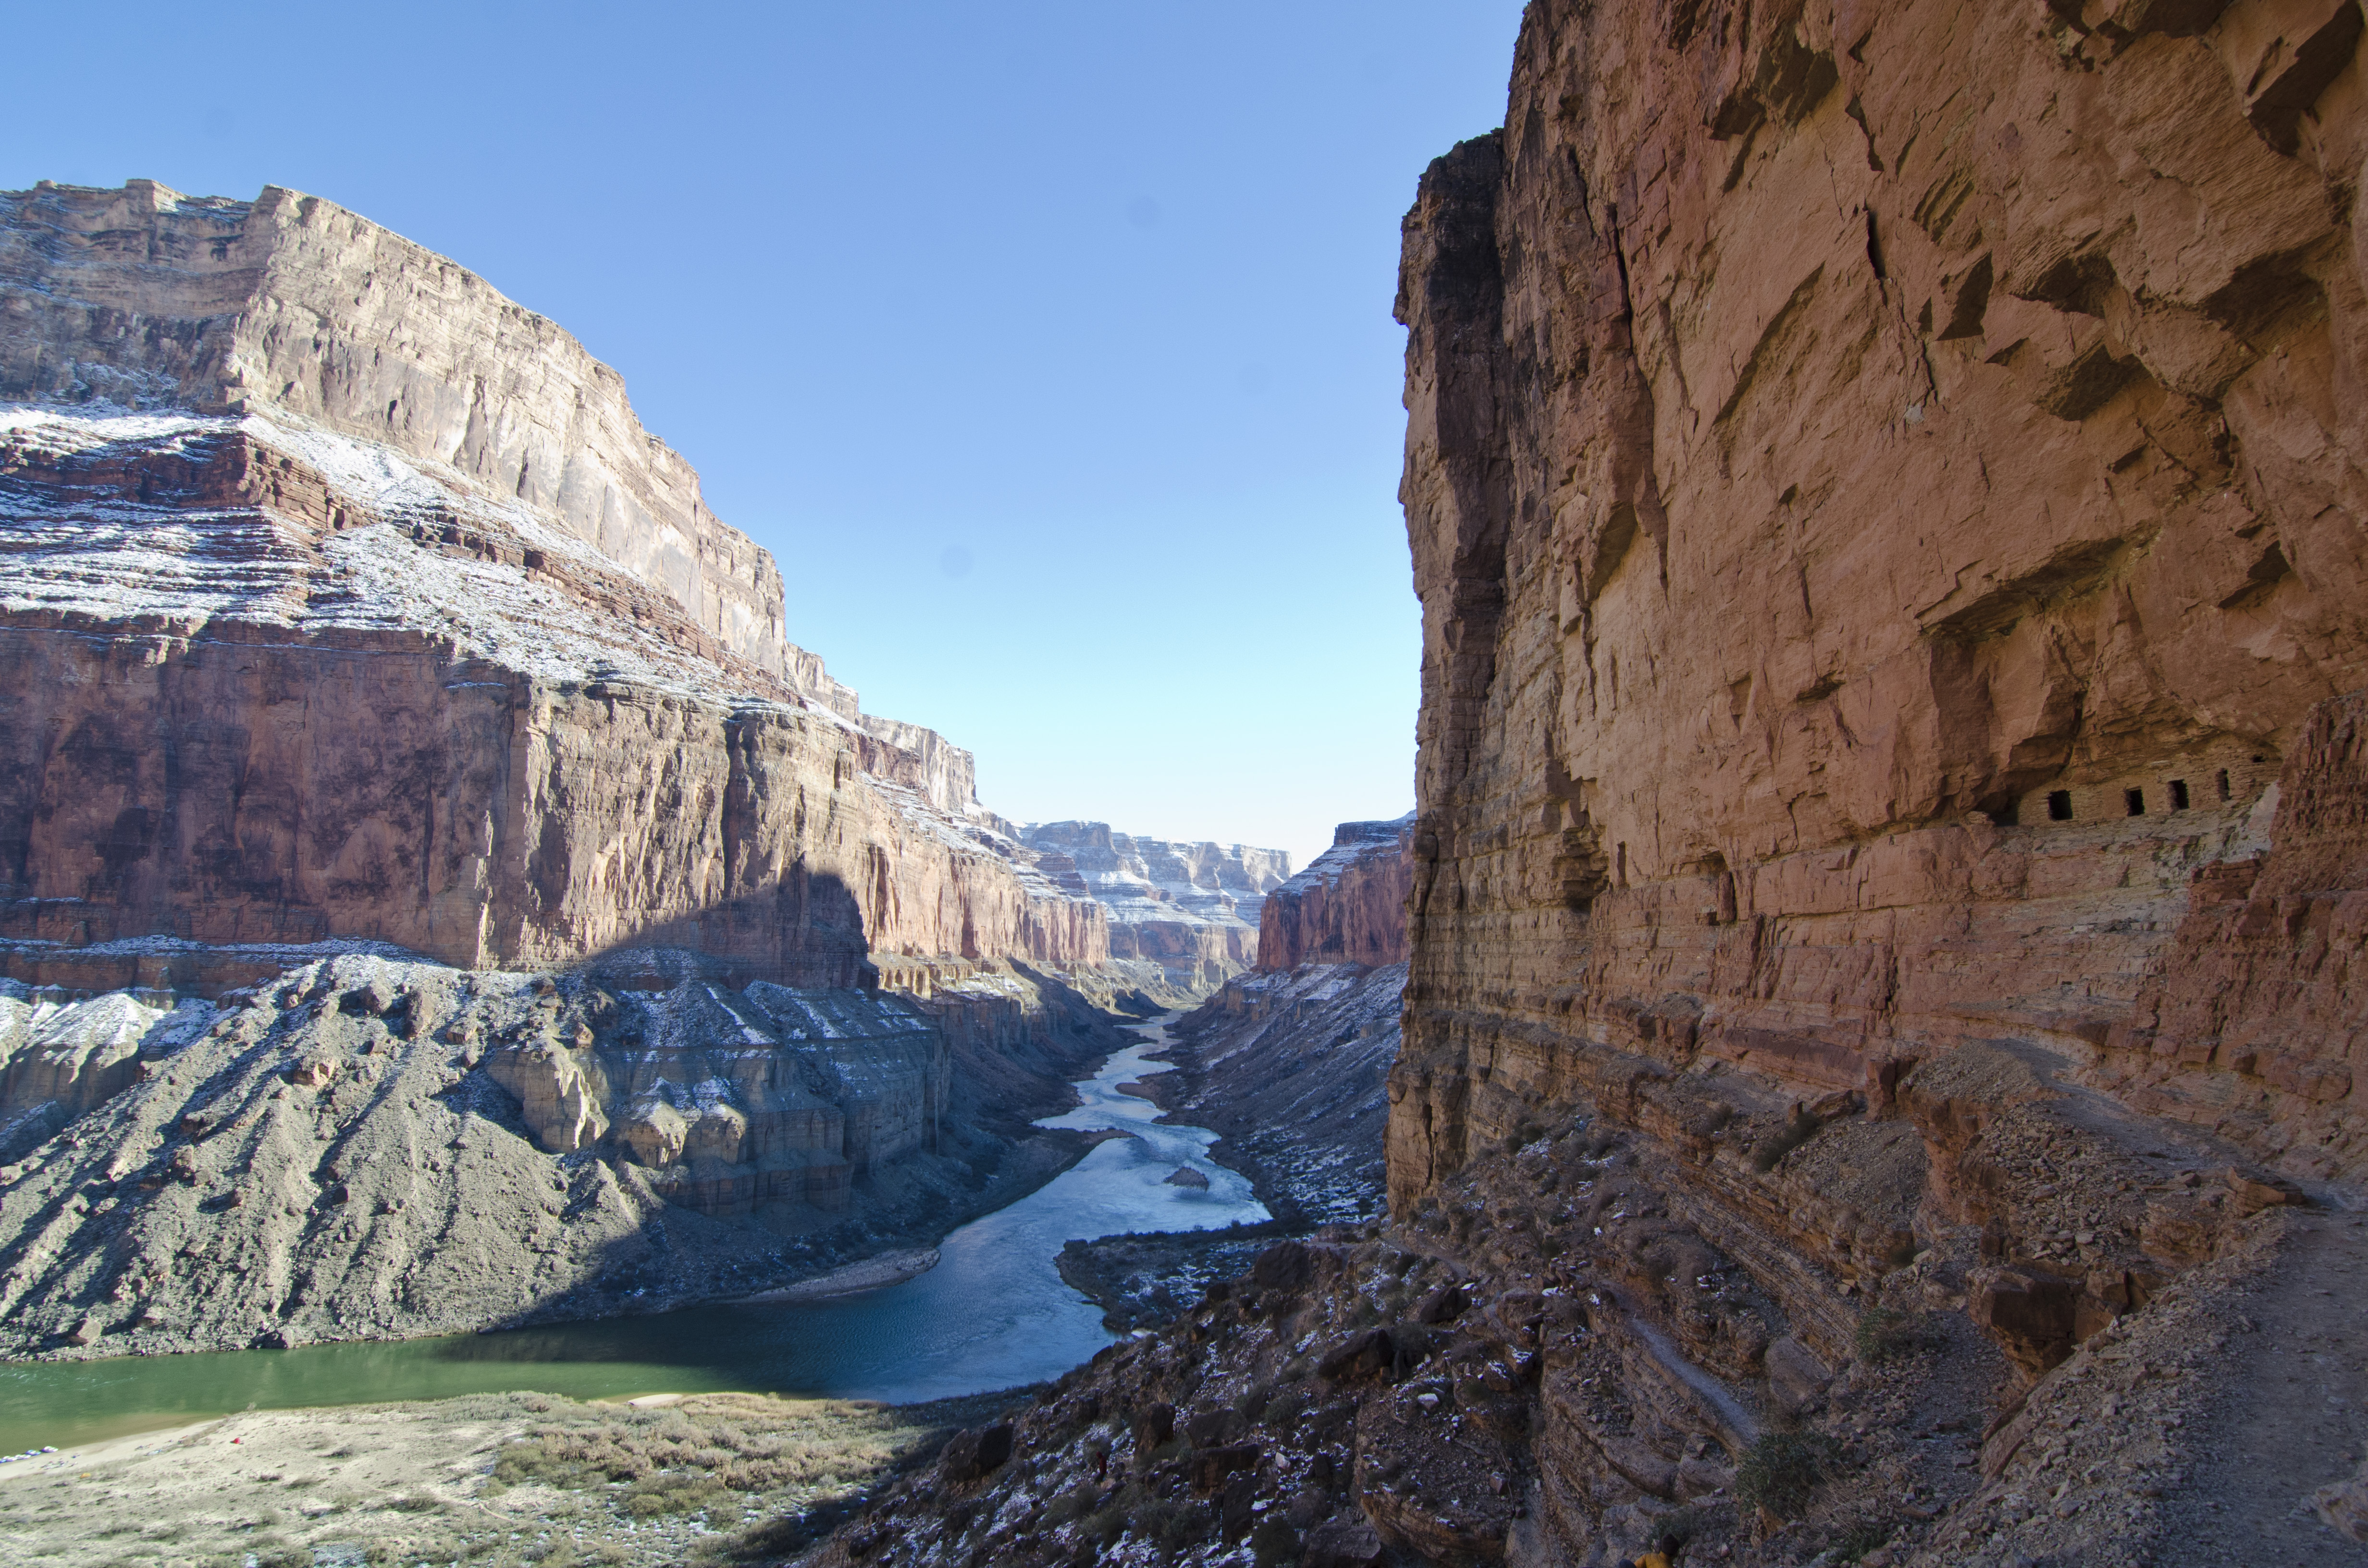
Year after year, reservations are made from across the world to visit Alaska and Arizona (or more accurately, the Grand Canyon).
Further Analysis
Combine all Years
All years should be combined into one DataFrame for queries and statistical analysis. While partitioning by year is convenient, it eliminates the ability to perform true hypothesis testing.
Histograms
A histogram of distance traveled is more useful than the mean and standard deviation alone. While difficult to formulate in a pyspark.sql query, histograms are more appropriate than statistical distributions in this analysis.
More granular maps
Cleaned DataFrame .pkl files with distance traveled, grouped by customer and facility ZIP codes, are also saved. More detailed mapping is feasible and potentially illuminating. Maps for average length of stay per region could also be produced.
Track CustomerId, not ReservationId
If tracking the last known reservation by customer is possible, one could prove / disprove the basis of the distance traveled calculation.
Footnotes
1: as calculated by the orthodromic distance between a reservation's `customerZIP` code to a facility's (`FacilityLatitude`, `FacilityLongitude`). As mentioned in the conclusions, this is likely an inaccurate measurement of the distance *actually* traveled.
2: and Hawaii and Alaska, which could be excluded as outliers.