Background
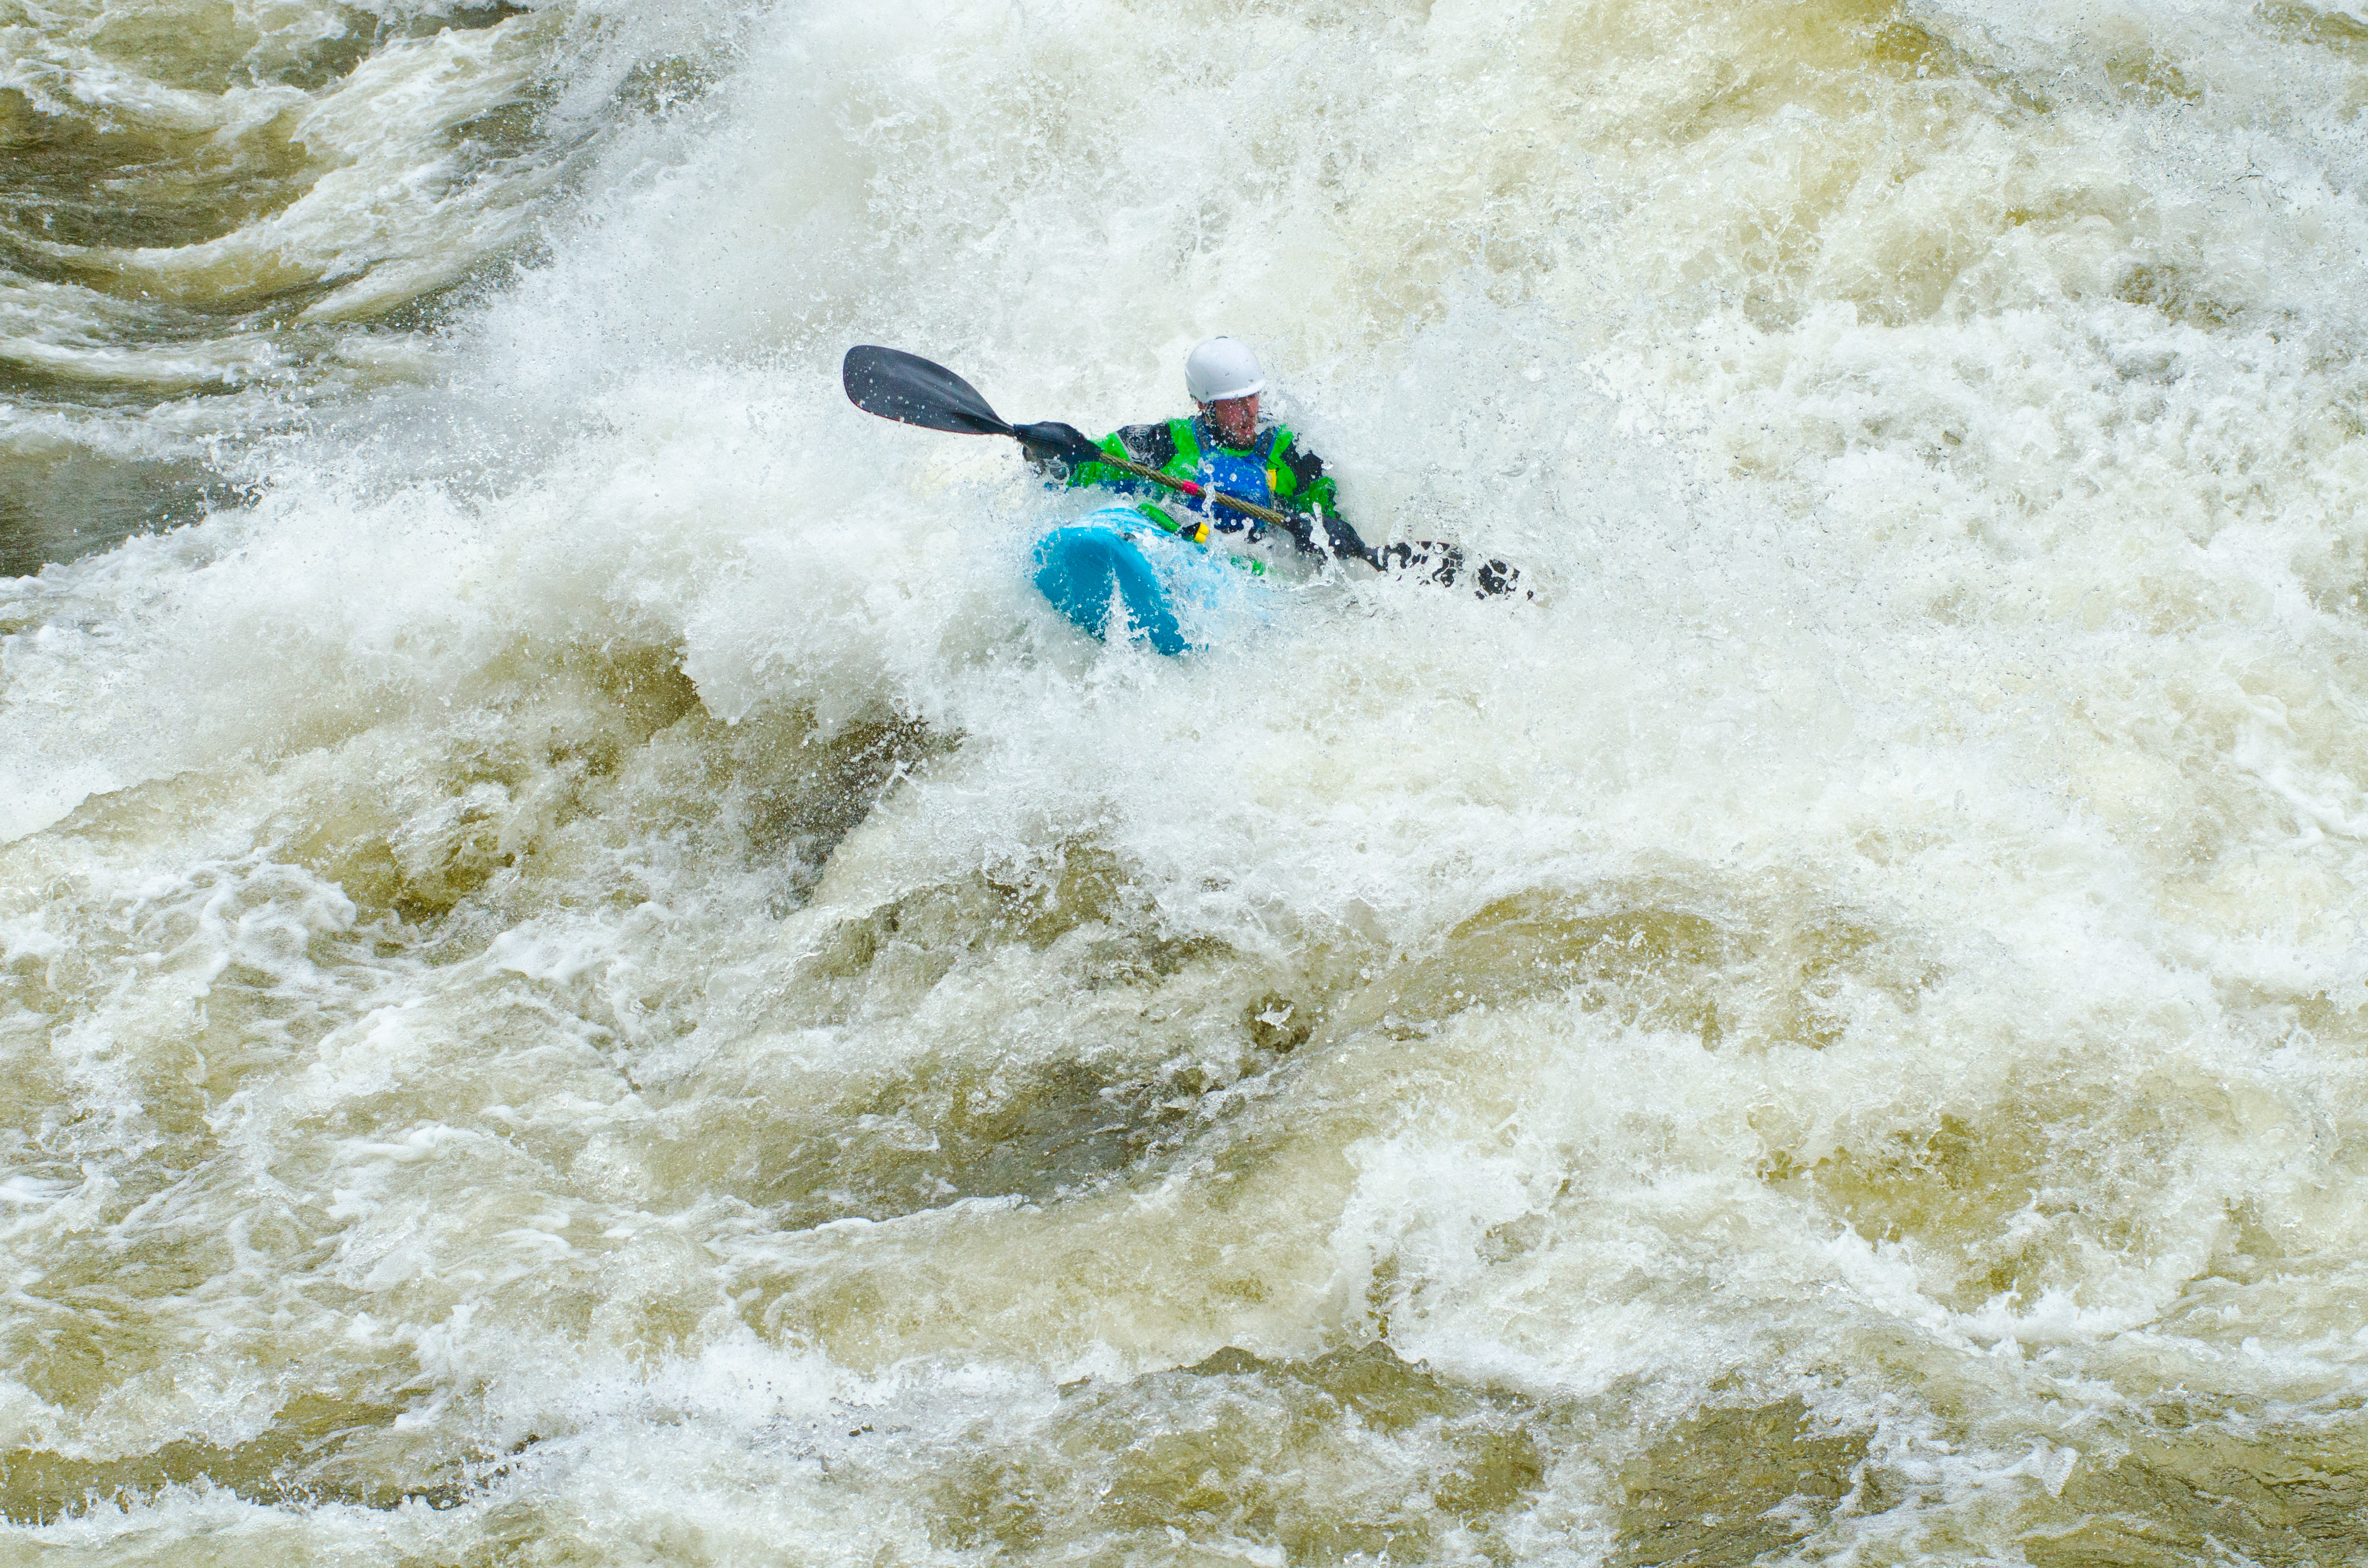
The American Whitewater Accident Database catalogs over 2,500 fatalities and close calls on whitewater rivers dating back to 1972.
The project was initiated in 1975 when Charlie Walbridge observed a fatality due to foot entrapment at a slalom race. Ever since, the American Whitewater journal has collected incident reports and shared the lessons learned. In 2017, the collection of accidents was refined and made available for download on American Whitewater's website.
These reports provide a learning opportunity to the paddling community, and facilitate dialogue with river managers and decision makers.
Purpose
The goal of this project is to identify risk factors in whitewater recreation that can turn near misses into fatalities.
Data
The database is created from a combination of user submitted forms and web-scrapped articles. As such, it is supremely messy.
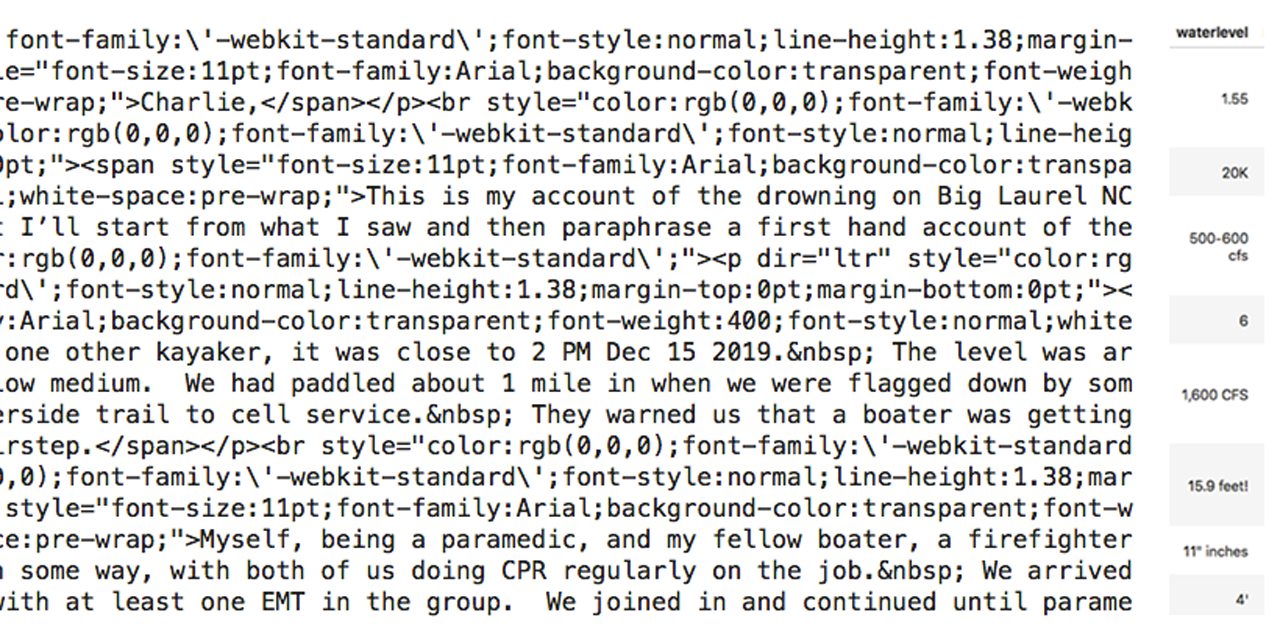
After deleting personal information, all text features (river, section, location, waterlevel, and cause) are combined into the description column.
In addition to the written narrative, this analysis focuses on:
- State (location)
- River level
- River difficulty
- Victim age
- Kayaking
- Commercial
- Experience
- Type of accident
- Fatality
- Medical (near miss)
- Injury (near miss)
The ordinal features: river level (Low, Medium, High, and Flood), river difficulty (I, II, III, IV, V), and victim skill (Inexperienced, Some experience, Experienced, Expert) are mapped linearly to integers.
Type of watercraft is mapped to kayak (1) or not.
Trip type are mapped to commercial (1) or not.
Given an unreasonable number of 0 year olds with contradictory description entries, ages equal to 0 are dropped.
Natural Language Processing
Cleaning
Because the descriptions of accidents are aggregated from both external websites and user submitted forms, the documents have very inconsistent structure.
All documents have some level of html embedded in them, and some are actually in json. The first step in the text analysis is to convert each document into one long string. The strings are then tokenized with a purpose-built script. Because of inconsistent description tense, the documents are lemmatized with spaCy into their root words before being vectorized into either a tf-idf or term frequency matrix with sklearn.
Once vectorized, the matrix is clustered with the k-means algorithm. The underlying structure reveals documents with high percentages of html words. The top words for those html clusters are added to the stopwords, and the process is repeated until salient, clean clusters emerge.
Latent Diriclet Allocation
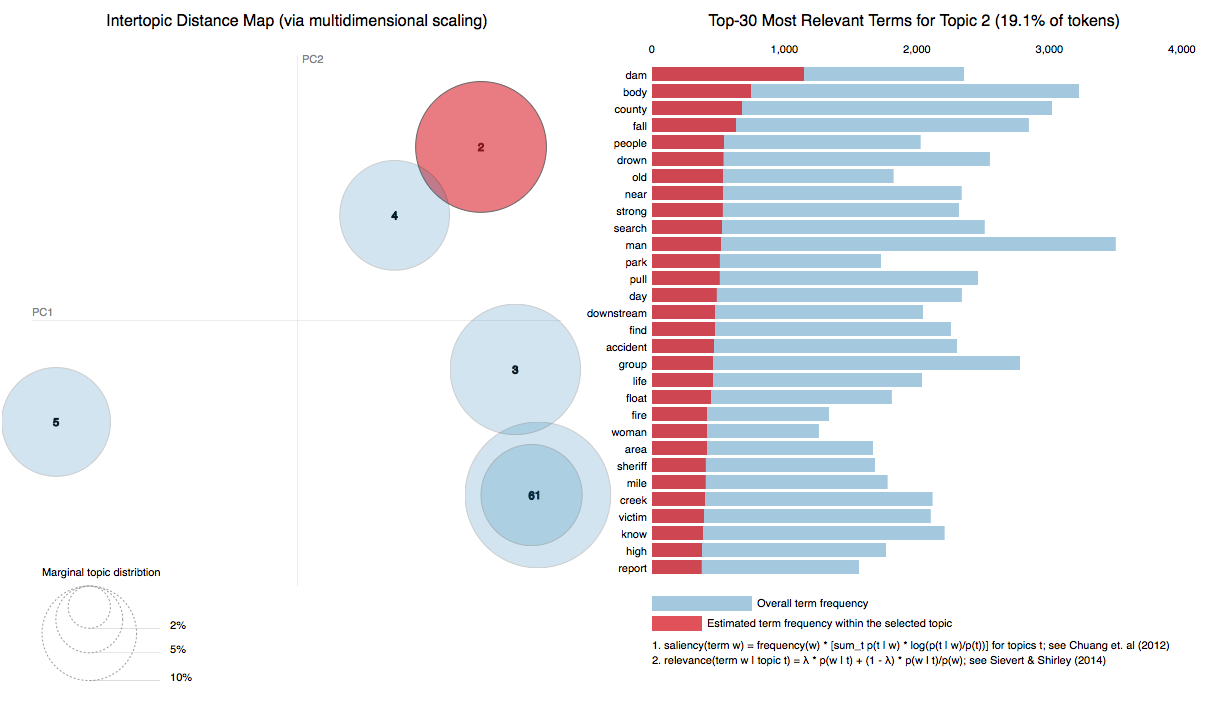
LDA does not illuminate any underlying structure.
Principal Component Analysis
Similar to LDA, PCA fails to provide new information. Indeed, less than 0.01% of the variance is explained in the first 8 components.
Below, the first two components are plotted with each accident labeled as a fatality, injury, or a medical emergency.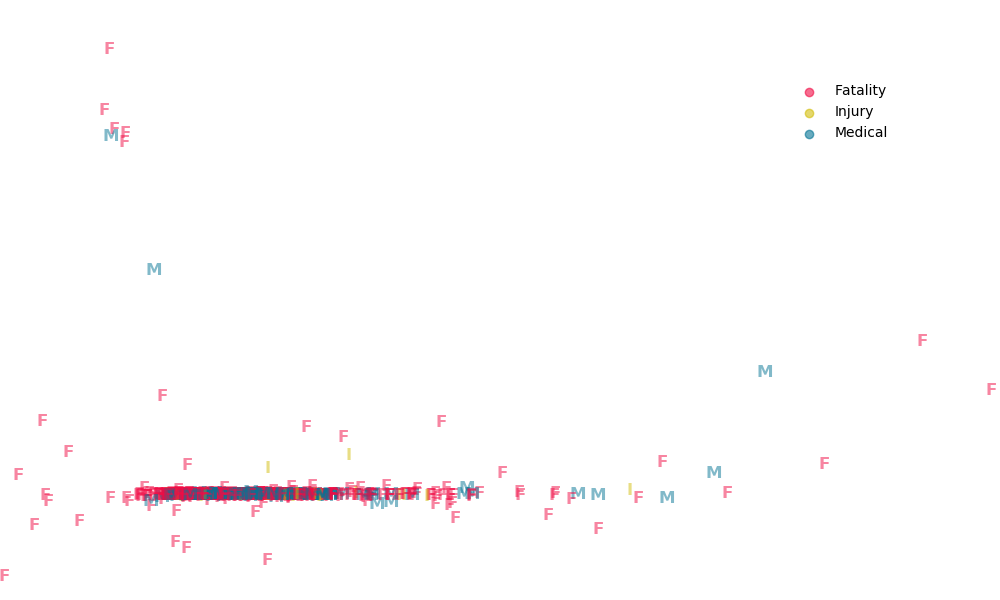
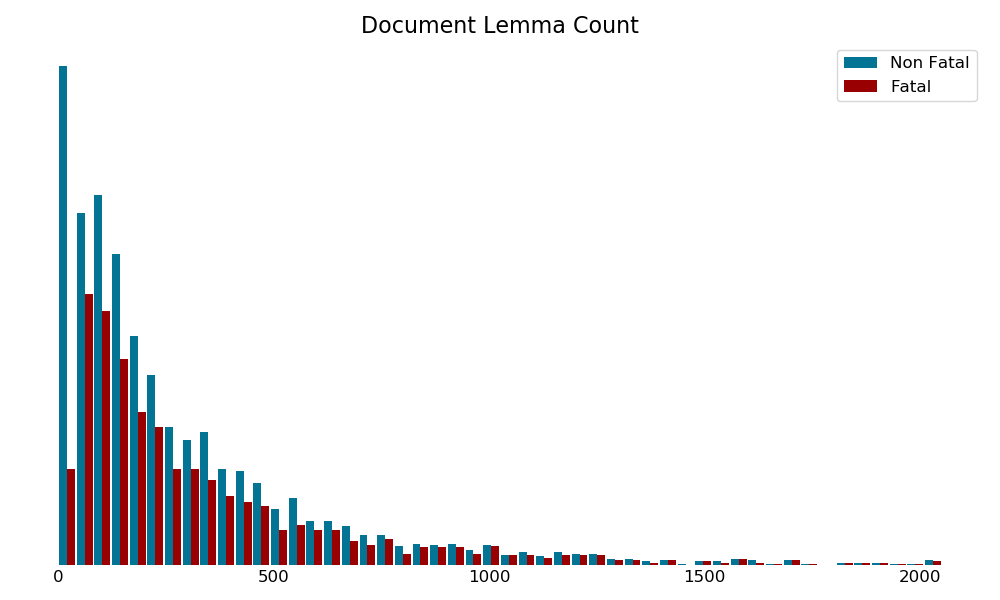
Description Length
As expected, as the descriptions of accidents become longer, a higher proportion of accidents are fatal.
Geographic Distribution
The number of accidents is likely proportional to the amount of whitewater recreation in a given state. Colorado, however, may be an outlier.

Histograms
Graphical EDA reveals an alarming fatality rate for young victims. Above 14 years old, age becomes positively correlated to fatality rate. Other trends are not immediately obvious.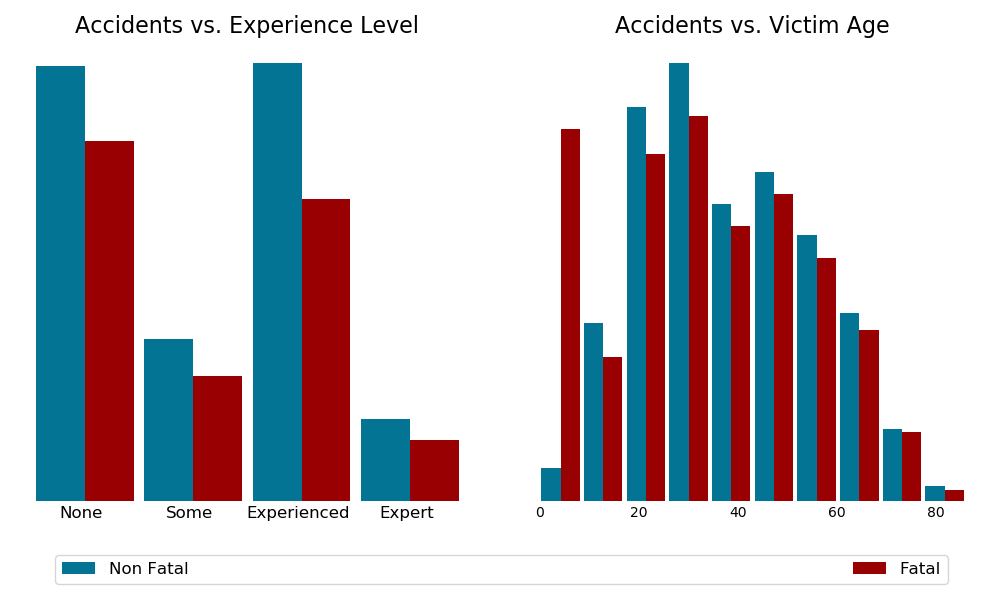
Supervised Learning
Sklearn grid searching with k-folds cross validation is used to find the best hyperparameters for each model. Models are tested on classification into three groups (Fatality, Injury, Medical) as well as Fatal or Near Miss. When possible, performance between Tf-idf and tf matrices is compared. Final performance is judged on a holdout data set. For simplicity and interpretability, only the binary classification results are shown.
Text Classification
Boosting
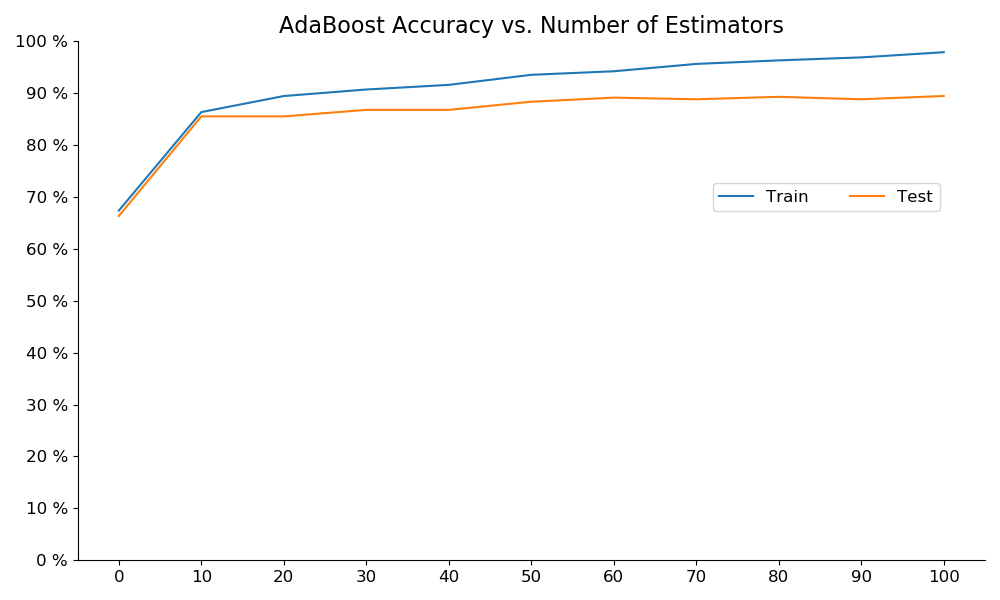
AdaBoost was not the best model, nor were the intrepritable features meaningful.
Bagging
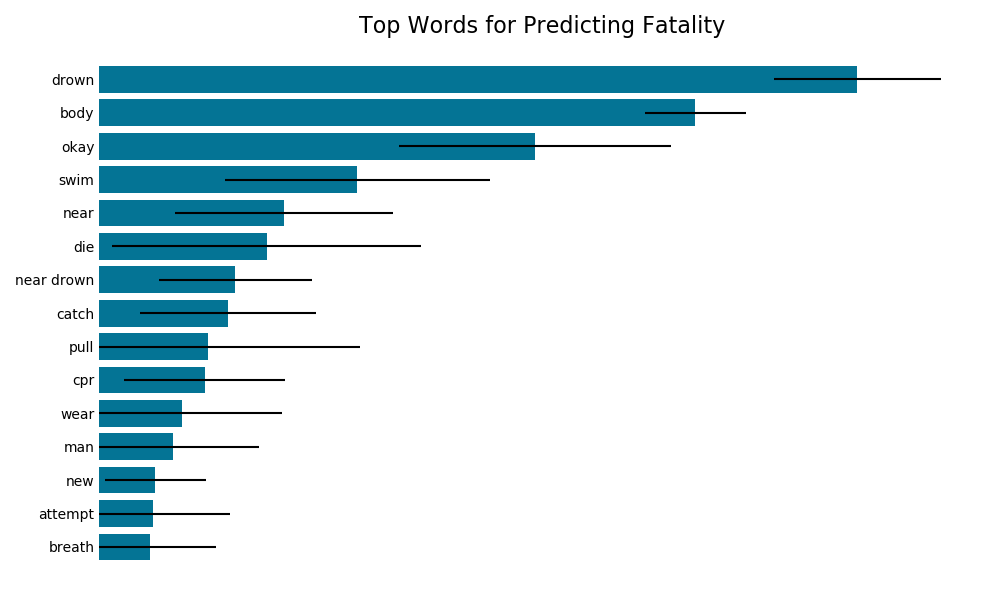
Below are the most important words for predicting the outcome of an accident. It is worth noting that the model does not assert a positive or negative correlation, just predictive importance.
Naive Bayes
After fitting a Naive Bayes model to the training data, for each category of incident, the top 20 words that made each category more and less likely are generated. Below is a curated subset of those lists.
| Increase Liklihood | Decrease Liklihood | |
|---|---|---|
| Injury | man, pin, foot, strainer, group, kayaker, march | farmer wetsuit, near drowning, new york, large kayak |
| Fatality | rock, dam, drown, pin, get help, search, rescue, time, large flow | competent group, thank, support, train, feel emotion, professional sar, respond |
Below, mock descriptions were fed into the naive bayes model with the resulting predictions.
There was a diabetic on our trip. He forgot his insulin. He ended up in DKA, so we pulled off of the the river. Luckily we had cell service, so we called 911. He got rushed to the ER, but the docs said he'd be okay even though he had been near death earlier that day. Another person on the trip was doing a bunch of drugs. They ended up falling in the river.
| Medical | Injury | Fatality | |
|---|---|---|---|
| Predicted Probaility | 99.9% | 0.0% | 0.0% |
It was the end of the day, and everyone was tired. The raft guide decided to drop into the last hole sideways, and dump trucked everyone into the river. There wasn't much rapid left at that point but most people found a rock or two to hit. Sarah bruised her leg. Sam hit his head. I got my foot trapped in the webbing of the raft. Everyone was okay, but a few of us had to get stitches.
| Medical | Injury | Fatality | |
|---|---|---|---|
| Predicted Probaility | 0.1% | 0.1% | 99.8% |
It could have been a good day of kayaking. The water levels were very high, but everyone was stoked. On the first rapid Jack capsized and swam into a strainer. Meanwhile, Jill got pinned in a sieve. Both spent about 10 minutes underwater before we could get to them. We performed CPR, but they we both blue. We called the sheriff, the ambulance came, and we cried a bunch.
| Medical | Injury | Fatality | |
|---|---|---|---|
| Predicted Probaility | 0.25% | 0.15% | 99.6% |
Numerical Classification
Logistic Regression
A simple logistic model is fitted on the non-text features. This model performs better than the text analysis. After removing features without predictive strength, the coefficients and their p-values are listed below. The variance inflation factors are all 1.3 or below.
| Coefficient | p-value | |
|---|---|---|
| River Level | 0.27 | 0.050 |
| River Difficulty | 0.45 | 0.003 |
| Paddler Experience | -0.34 | 0.034 |
Stacked Model
Adding the Naive Bayes prediction as a feature in the logistic model, oddly, decreases performance.
Model Performance
| Precision | Recall | Accuracy | |
|---|---|---|---|
| AdaBoost | 86% | 92% | 86% |
| Bagging | 87% | 92% | 87% |
| Naive Bayes | 76% | 95% | 79% |
| Random Forest (NLP) | 77% | 98% | 81% |
| Random Forest (Numerical) | 87% | 97% | 87% |
| Logistic Classification | 92% | 100% | 92% |
| Logistic Regression | 88% | 92% | 84% |
| Stacked Classification | 88% | 92% | 84% |
Conclusions
Combining the information from clustering, topic modeling, natural language processing, and logistic modeling, a few conclusions can be made. However, mostly the data supports existing knowledge in the whitewater community.
- Go with a "competent group" - more than any other, this phrase decreased the likelihood of a prediction for death
- 84% of the reported accidents where the victim is less than 18 years old are fatal
- Be weary of the "first major rapid"
- Avoid dams and other man-made hydraulics
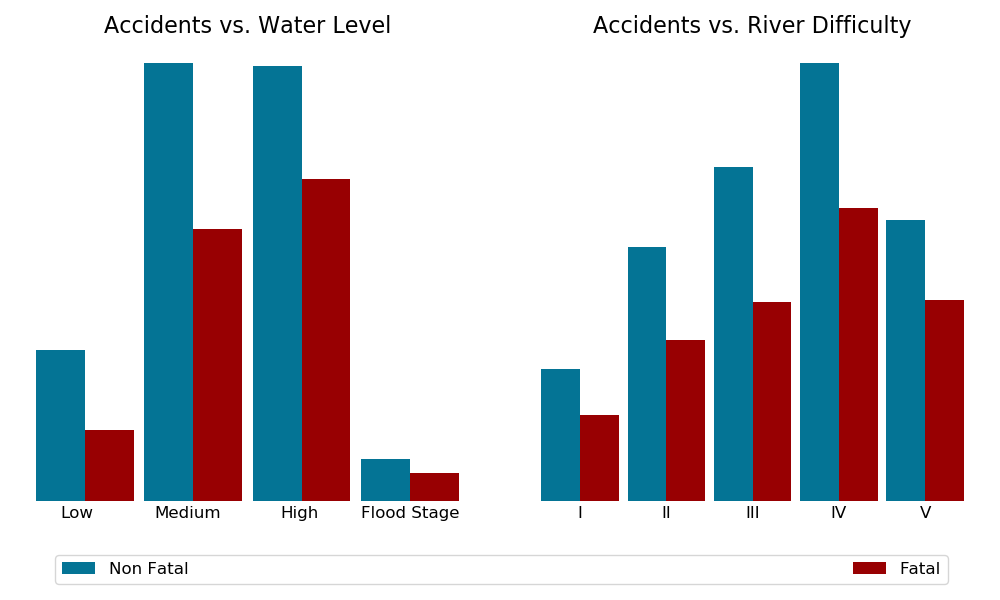
- Higher flows tend to be more deadly
- More difficult rivers tend to be more deadly
- More experience increases the odds of survival
- Wetsuits reduce the liklihood of injury
- Given an accident: noteable netatives
- Age and skill are not correlated
- Age and commerical trip / private trip are not correlated
- Skill and river difficulty are not correlated
- Kayaking does not change the rate of fatality
- Most regions have similar accident causes
Further
Stay safe out there!
